Author Archives: joaaelst

Diversified seed-source portfolios and uncertainty in reforestion outcomes

Because the climate is changing quickly and trees tend to be genetically adapted to past climate conditions, managers across the globe have begun to implement climate-adapted seed transfer, wherein tree seedlings are planted in locations where current and anticipated climate conditions better match their genetic adaptations. This typically involves planting seedlings at higher elevations or more poleward latitudes than their seed source, in order to track climate change.

Table 1. Some sources of uncertainty inherent to seed selection and climate adaptation.

TypeDescription
GeographicClimate uncertainty arising from use of imprecise and climatically heterogenous spatial units (e.g., seed zones). Geographic uncertainty in both planting and seed-source location can be eliminated by using precise spatial information. However, much of the existing seed inventory in state and federal seedbanks suffers from substantial geographic uncertainty.
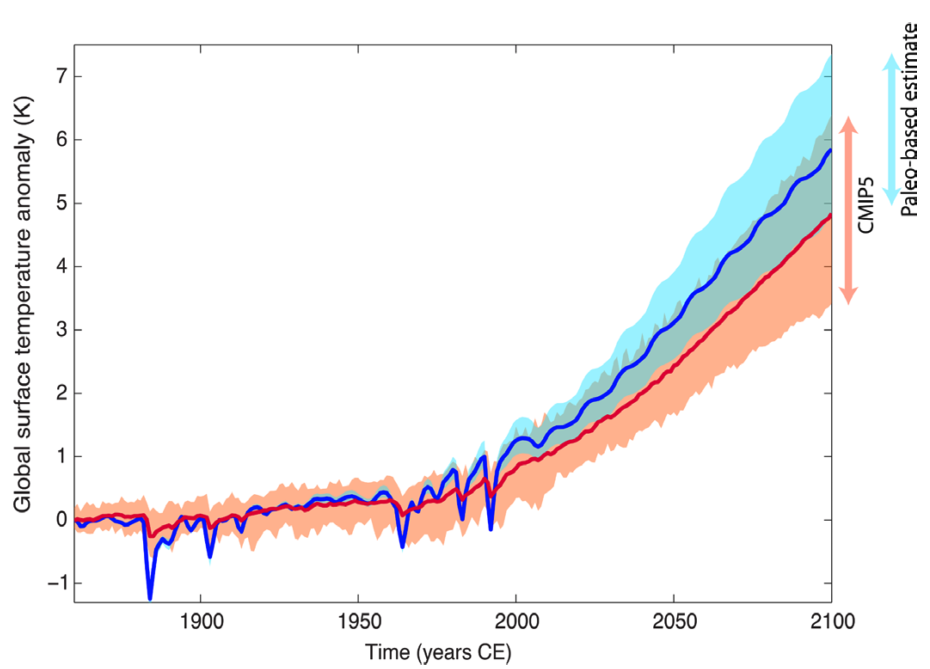
Future ClimateUncertainty in what the future climate will be. Two components include (a) climate sensitivity–how sensitive the climate is to GHG-forcing, and (b) emissions pathway–the quantity and timing of future GHG emissions.
ModelUncertainty arising from the inability of statistical models to predict 100% of the variation in outcomes. For instance, climate transfer functions perform well predicting the average outcome of multiple seed sources planted into a new location, but substantial uncertainty remains in the performance of individual seed sources.

Planting trees necessarily involves uncertainty in survival and growth rates, which in turn means uncertainty in carbon sequestration, timber production, ecosystem services, and habitat value (Table 1). Landowners and managers tend to strongly prefer more reliable reforestation outcomes. In myriad domains, from finance to ecosystem management, diversified portfolio or “bet-hedging” strategies are used to optimize tradeoffs between expected returns and uncertainty in those returns. How can diversified portfolios of seed sources be used to minimize the uncertainty of reforestation outcomes while maximizing forest health and productivity?

Figure 1. Large decreases in the uncertainty of reforestation outcomes may be achieved by planting optimal portfolios of multiple seed sources at reforestation sites. This conceptual diagram, representing results from six million simulations, is based on data from a large seed transfer experiment (O’Neill & Nigh 2011) and estimates of future climate uncertainty derived from global circulation models (Pierce et al. 2014). Left Panel: Selection of optimal portfolios (labeled A-E) relative to the efficient frontier (solid curve). Right Panel: Curves depict probability distributions. Boxes depict medians and interquartile ranges.

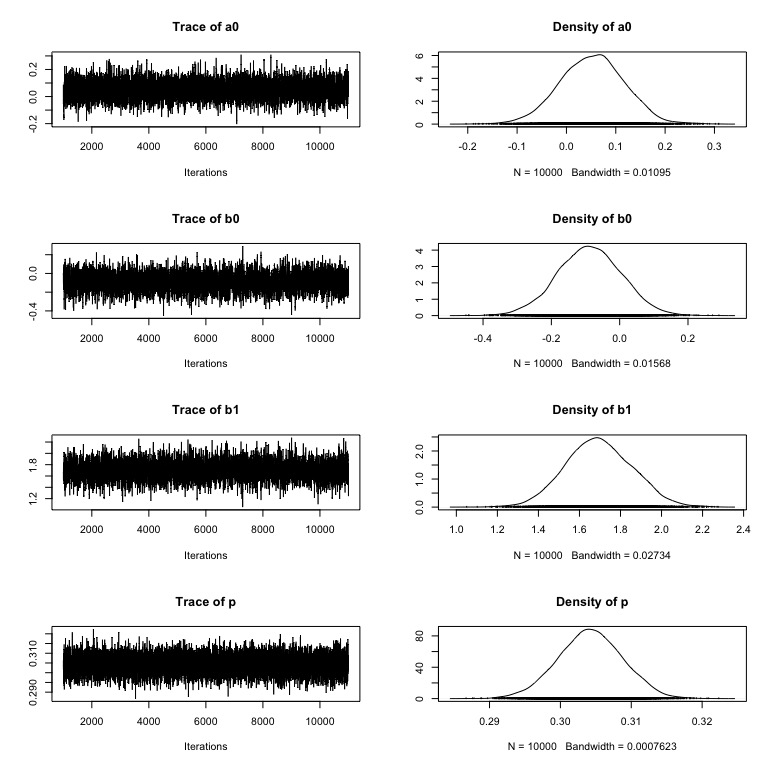
To take a first look at this problem I used data from the Illingworth Trial, which planted over 70,000 Pinus contorta seedlings from 140 seed-source locations in 62 common gardens and measured them for 32 years (O’Neill & Nigh 2011). I fit a univariate, asymmetric, gaussian climate transfer function to predict relative tree volume and its uncertainty as a function of mean annual temperature (MAT) transfer distance (site climate – source climate). I considered 26 candidate seed sources–each adapted for optimal performance at a different MAT, and randomly generated 6,026 candidate portfolios each composed of different proportions of each seed source. Based on the results of global circulation models (GCMs) I assumed that the probability of realized MAT at our planting site follows a normal distribution with a standard deviation of 0.8 °C (Pierce et al. 2014). I then ran 1,000 simulations per portfolio to assess the probability distribution of outcomes associated with each portfolio. Based on the outcome of these simulations I selected optimal candidate portfolios that fell near the efficient frontier (Dragicevic et al. 2016). This simplified approach serves as a proof of concept and provides a glimpse of the improved reliability that could be achieved by using diversified portfolios of seed sources in reforestation (Fig. 3).

It appears that the risks associated with the common strategy of planting a single seed source at a reforestation site can be mitigated substantially. Diversified portfolios necessarily produce more reliable outcomes when the performances of the individual components of a portfolio of assets (whether they are trees or financial instruments such as stocks) are less correlated and the number of assets in the portfolio is larger (Markowitz 1952). To illustrate this, consider future climate uncertainty at a given reforestation site. If we plant a single seed source–genetically adapted to the mean expected climate at the site–it will be subject to reduced growth and survival when realized climate conditions vary from our expectation. In contrast, if we instead plant two seed sources, adapted respectively to conditions slightly warmer and cooler than the mean expected climate such that their performance tends to be negatively correlated, the overall outcome will become more reliable. Data from seed transfer experiments indicate that the performance of different combinations of seed sources (in multidimensional climate space) ranges from negatively correlated, to uncorrelated, to positively correlated. Using data from seed transfer experiments, we can construct optimal portfolios of seed sources that maximize both average reforestation outcomes and their reliability (Weng et al. 2013).

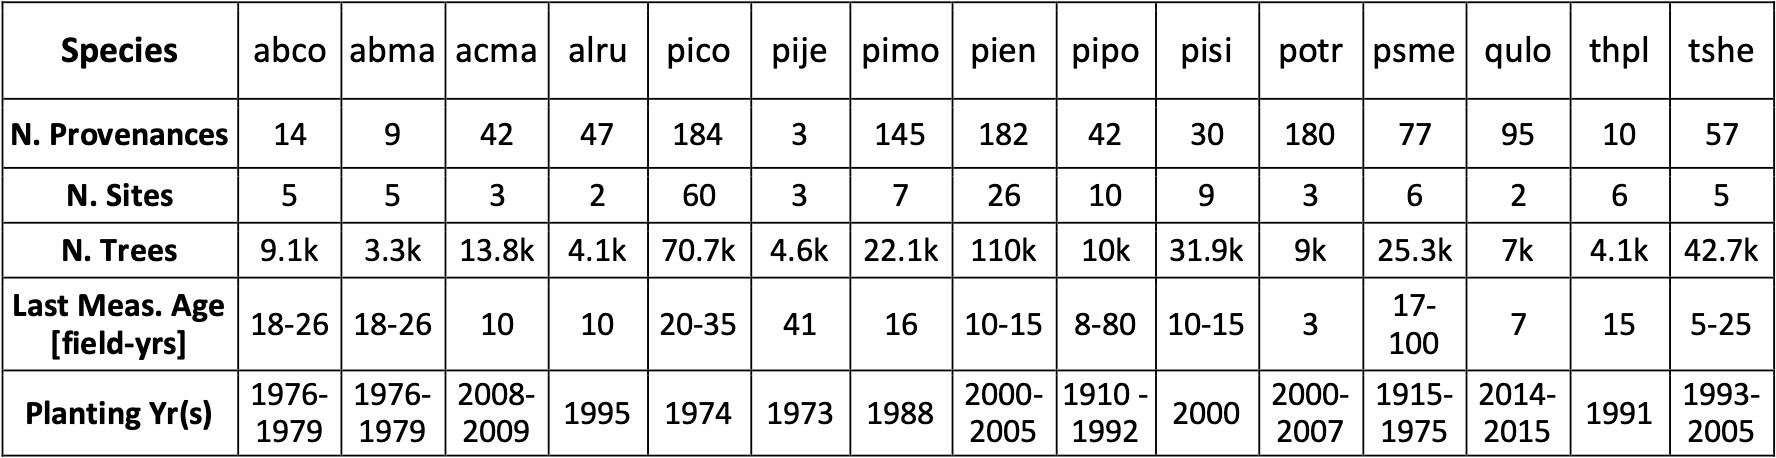
Table 2. Characteristics of extant common garden (AKA “provenance test” or “seed transfer experiment”) datasets that may be suitable to use in this component of the project. 4-letter species codes are based on genus and species names. For example, abco = Abies concolor, pico = Pinus contorta.

While the analysis outlined above makes a few simplifying assumptions, we plan to expand on this approach to more fully and accurately predict the probability distribution of outcomes associated with optimally diversified portfolios of seed sources. This work is funded by the University of California Office of the President. Whereas the simplified approach accounts for only one dimension of climate, the full approach will account for seed adaptations to, and uncertainty in, multiple dimensions of climate (e.g., seasonal variation in temperature, precipitation, etc.). Whereas the simplified approach does not account for how uncertainty varies as a function of the number of trees planted, the full approach will leverage available data to account for this relationship. Whereas the simplified approach makes assumptions about the shape and collinearity of probability distributions, the full approach will better account for these important factors. Whereas the simplified approach does not account for geographic uncertainty in the origin of seeds (e.g., seed zones), the full approach will incorporate this uncertainty. We plan to leverage much of the available data from extant common garden datasets planted in western North America in these analyses (Table 2). Finally, we will seek to develop efficient algorithms that can identify and propose optimal portfolios of available seed sources in real-time (i.e., in response to user inputs to an online tool such as the Climate-Adapted Seed Tool).

In the meantime, given apparently ubiquitous preferences for reliable outcomes (Dragicevic et al. 2016), we suggest that reforestation projects use at least a few different seed sources per species planted. Of course, each of these seed sources should also be selected to match the genetic adaptations of the seed source with the climate of the planting site. For example, with the current version of CAST, this could be accomplished by using the top three candidate seed sources for the climate conditions of your planting site. Alternatively, a bit more diversification could be introduced by varying your expected climate conditions. For instance, instead of selecting seeds adapted to the expected climate ~20 years in the future at your site, you could select one seed lot adapted to ~20 years into the future, another adapted to expected conditions ~15 years in the future, and another adapted to expected conditions ~25 years in the future. If regionally appropriate, diversification in the form of planting multiple species at each site also appears poised to result in more reliable and resilient reforestation outcomes.

The passing of Barry Sinervo

Barry leading a herpetology field trip at Angelo Coast Range Reserve

My dear friend, mentor, and PhD advisor, Barry Sinervo, passed away last night. Barry taught me that having the audacity to attempt challenging things is worth it because you might just succeed. He was humble where it counted, always open to scientific ideas that contradicted his own–even if convincing him took a few attempts. Like other giants of science, Barry exemplified how creativity and lateral thinking are just as important to scientific advancement as empiricism and critical thinking. His fluid ability to make connections between the languages of creativity, math, nature, and persuasion was a phenomenon to witness. I miss him dearly.

Extinction of pikas from the Pluto triangle

Today, more than six years after I first found old pika scat in the area, a study documenting extinction of the American pika from an unprecedentedly large region, has finally been published in the peer-reviewed journal PLOS ONE. Conservation science—with its meticulous data analysis, limited budget, and lengthy peer review process—can progress slowly. But what this study, and other studies, show is that large-scale range contraction from climate change can happen over a relatively short time span.

Map of the study area. We refer to the roughly triangular area surrounding Mt Pluto—bounded by Lake Tahoe, the Truckee River, and Highway 267—as the Pluto triangle. Radiocarbon dating was used to determine the age of old pika scat collected at extirpated sites within the triangle.

The study documents the extinction of pikas from a 165-km2 area of the northern Sierra—the largest area of pika extinction yet to be reported in the modern era. We refer to the area of extinction surrounding Mt Pluto as the Pluto triangle. The large spatial extent of the die-off echoes large-scale range collapses that happened when temperatures increased after the last ice age. Radiocarbon dating of relict pika scat recovered from the triangle indicates that pikas likely disappeared from many of the lower elevation sites surrounding Mt Pluto before 1955, but persisted near the peak as recently as 1991.

The local pika extinction opens a large gap in the pika’s distribution north of Lake Tahoe. Before their collapse, pika populations in the Pluto triangle region could be thought of as an isthmus of modest-elevation habitat connecting the mainland stronghold of pikas—the crest of the Sierra on the west side of Lake Tahoe—with a peninsula of pika habitat (Mount Rose/Carson Range) on the east side of Lake Tahoe. The triangle was central to a contiguous area of pika distribution. The loss of pikas from the triangle suggests the complete loss of metapopulation and genetic connectivity through this corridor.

The study also used local occupancy data to project future effects of climate change on pikas. By 2050, we predict the extent of climatically suitable land in the Lake Tahoe area will decline by 97%.

Decline in the area of climatically suitable habitat for pikas over time. The boundary between white and tan is the approximate threshold above which conditions become tenuous for pikas.

Worryingly, this isn’t the only large area where pikas appear to have recently gone the way of the dinosaurs. A study published last month in Western North American Naturalist documents both the discovery and apparent extinction of pikas from the Black Rock Range of Nevada. The extent of this extinction, depending on how you draw the boundaries, is at least ~45 km2. Another study, published last year in the Journal of Mammalogy, documents the apparent extinction of pikas from Zion National Park. Though the area of formerly occupied habitat in Zion appears to have been relatively small (< 3-km radius) it appears to constitutes the complete extinction of pikas from the national park. The apparent extinction of pikas from Zion National Park happened sometime between 2011 and 2015.

Of course it’s not just American pikas that are declining because of climate change. Nearly half of all plant and animal species that have been examined so far have already experienced local or regional extinctions that appear to have been caused by climate changeThe first (documented) extinction of an entire mammal species due to climate change occurred sometime between 2011 and 2014. Our best estimate right now is that about one million species are vulnerable to extinction from climate change this century (one in six species on Earth). There are management actions we can take to help many of these species, but a far simpler (and more economical) solution than trying to save each of these species individually is to rein in and reverse climate change.

In the case of the American pika, and many other species vulnerable to climate change, more work is needed to establish baseline data so that future research can accurately measure the extent of their decline. The best strategy for conserving many of these species may involve targeted gene flow, wherein a small number of individuals will be translocated from warm-adapted populations to populations that lack these adaptations.

A simple Bayesian occupancy model for two interacting species with R and jags

We begin by simulating survey data for two commensal species for the following scenario. Species 1 has a 50% probability occupancy. Species 2 benefits from the presence of species 1, so its probability of occupancy is 83% when species 1 is also present, but only 50% in the absence of species 1. One hundred sites are surveyed 10 times each. The probability of detection for both species is 0.3.

data_generator_commensal_species = function(psi, p, nSites, nReps){ # occupancy prob psi, detection prob p
 # true occupancy state
 z1 <- rbinom(nSites, 1, psi)
 z2 <- rbinom(nSites, 1, psi + z1/3)
 # sampling of true occupancy state
 y1 <- matrix(NA, nSites, nReps)
 y2 <- matrix(NA, nSites, nReps)
 for(i in 1:nSites) {
 y1[i,] <- rbinom(nReps, 1, z1[i]*p) # detection history for species 1
 y2[i,] <- rbinom(nReps, 1, z2[i]*p) # "" species 2
 }
 list(y1,y2)}
y = data_generator_commensal_species(psi = .5, p = .3, nSites = 100, nReps = 10)

We specify the model structure in jags.

model {
## Priors
a0 ~ dunif(-5, 5)
b0 ~ dunif(-5, 5)
b1 ~ dunif(-5, 5)
p ~ dunif(0, 1)

## Model
# State process
for(i in 1:nSites) {
 logit(psi1[i]) <- a0
 logit(psi2[i]) <- b0 + b1 * Z1[i]
 Z1[i] ~ dbern(psi1[i])
 Z2[i] ~ dbern(psi2[i])
# Detection process
 for(j in 1:nOccs) {
   y1[i, j] ~ dbin(p, Z1[i])
   y2[i, j] ~ dbin(p, Z2[i])
   }
 }
}

Then we fit the model with R and jags.

library(rjags)
d = list( y1 = y[[1]], y2 = y[[2]], nSites = 100, nOccs = 10)
mod = jags.model("commensal_multispecies.txt", d)
update(mod)
post = coda.samples(mod, c("a0", "b0", "b1", "p"),1e4)
summary(post)
plot(post)

Here are the posterior distributions. A nice fit to the scenario for the simulated data.

Pika featured on NatGeo

Our research was featured on the Years of Living Dangerously series on the National Geographic Channel. Here I am with the pika and Aasif Mandvi.


Erratum: When I interact with the media I do my best to convey the research accurately and hope for the best from the editing process. Here are a few small erratum/clarifications from this scene:

  • The scene cuts from me mentioning pika short calls, to me imitating long calls, then to pika footage from Colorado.
  • It is indeed legal to hunt pikas in some places such as Alaska. To my knowledge this practice is rare. Hunting is not an appreciable contributor to pika declines.
  • I misspoke somewhat when I said, “in Yosemite more than half of the small mammals they looked at were disappearing from low elevation sites.” I should have said “more than half of the small mammals they looked at were shifting their distribution upslope.” Moritz et al 2008 found that 57% of species (16/28) they looked at shifted their distribution upslope significantly (p < 0.05) either through lower elevation range contraction or upslope range expansion.

Have we been underestimating the Earth’s sensitivity to GHGs?

Recent studies suggest that science may have underestimated the climate’s sensitivity to greenhouse gasses. Armour 2016 discusses upward-adjustments in historical-era estimates of temperature sensitivity to account for the location of ocean surface temperature measurements, different types of climate-forcings, and time-delayed response. Friedrich et al 2016 found that the Earth’s climate-sensitivity over the past 784,000 years was greater than what the current (CMIP5) suite of climate models would suggest. Critical questions remain in how quickly the climate responds to forcing.

Paleo-Climate Sensativity

Paleoclimatic estimates of climate-sensitivity over the Pleistocene suggest that the current suite of CMIP5 models may underestimate the climate’s sensitivity. Figure from Friedrich et al 2016. Shown is RCP8.5 emission scenario.